Charles Booth’s poverty map of London: where does your street rank?
Charles Booth’s poverty maps have been digitised by the London School of Economics allowing us to compare streets then and now.
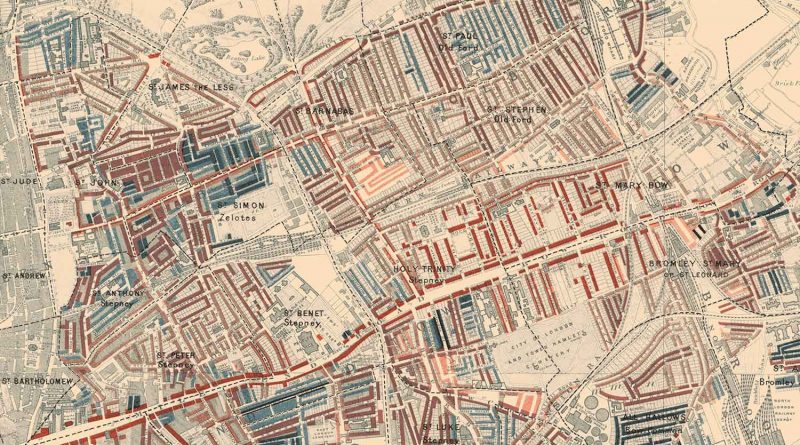
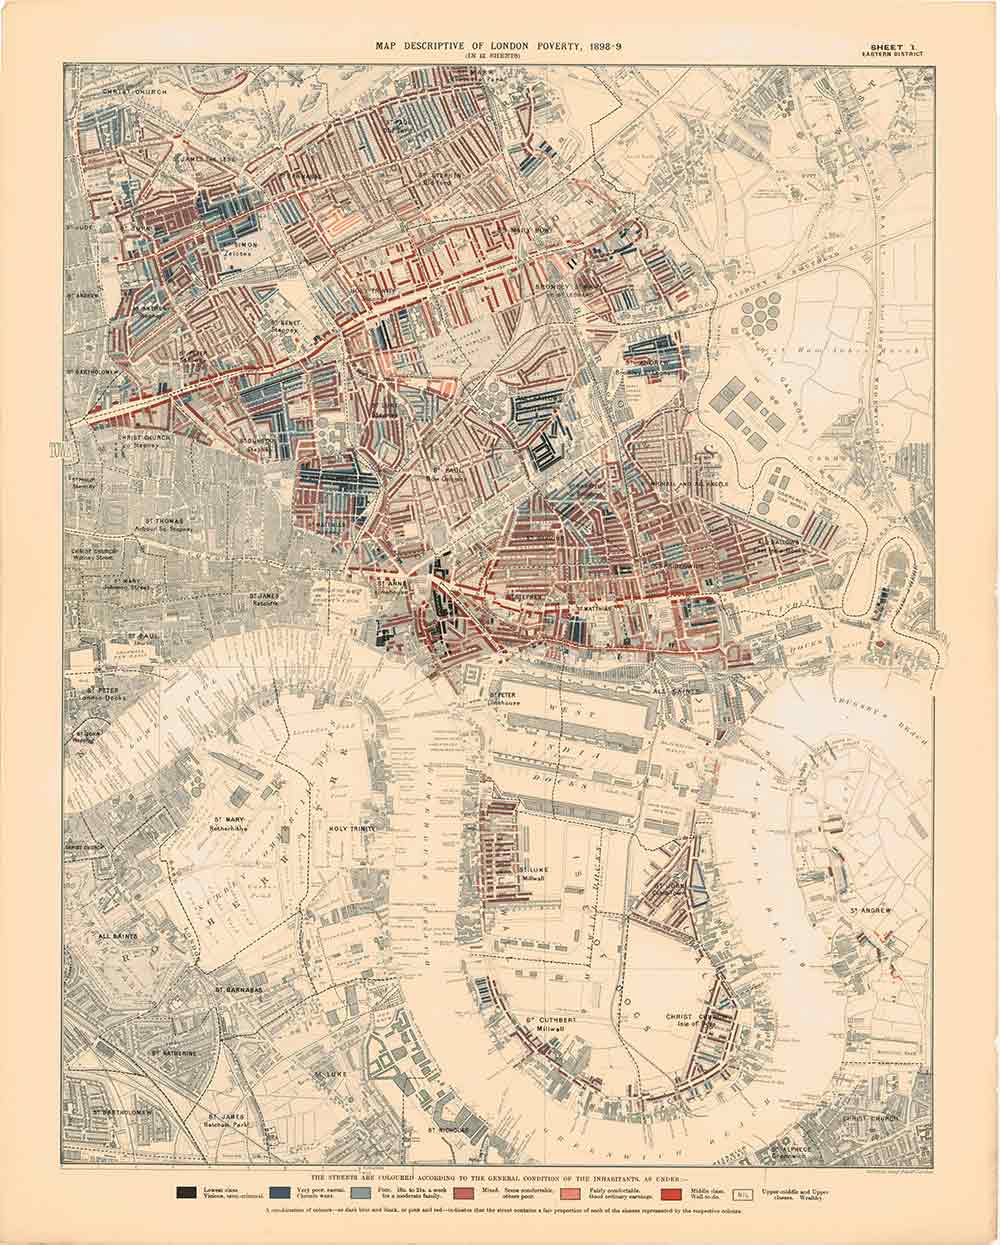
Nineteenth century social reformer Charles Booth, drew a famous ‘poverty map’ measuring how deprived or well-off households were on a street-by-street basis. Now, you can see how your area measures up thanks to the London School of Economics (LSE), who digitised the map in high-res. Where does your street lie, and how much has changed in Tower Hamlets today?
Charles Booth was a Victorian Era businessman, researcher and social reformer who painstakingly researched and catalogued levels of income and overcrowding in London. He started his work in 1886 and he spent the next fifteen years adding to it. The jewel in his research is his ‘poverty map’, which paints a granular, street level portrait of the varying levels of deprivation across London.
The deeper the red, the richer the household, with gold representing the upper classes. Shades of blue represent households that are ‘deprived’, with deeper blues showing households with ‘chronic want.’ Areas shaded in black are lowest rung on the socio-economic ladder – those who might rely on criminal acts to earn a living.
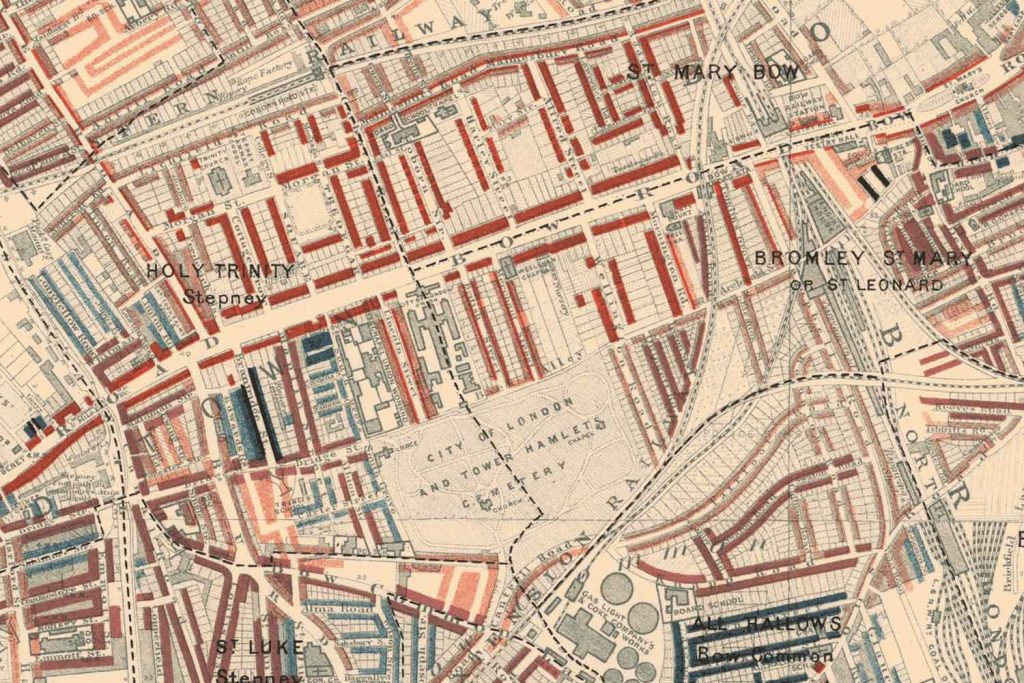
Despite the widespread poverty during the Victorian Era of the East End, it might surprise you to learn that the Roman Road area did not just consist of abject poverty. Rather, much like today, it is a mixture of poorer and more comfortable middle-class households.
Certain streets might be deep blue – showing a high level of poverty – but others nearby are deeper reds. Much like the Tower Hamlets today, this area is a mishmash of varying income levels.
Much like 130 years ago, Tower Hamlets today contains some of the poorest areas in England. According to a 2019/20 report, approximately 40% of Tower Hamlets live below the poverty line. In a sad echo of child poverty rife in the Victorian East End, Tower Hamlets today has the highest rates of child poverty in the whole of the UK, at 51%.
But there is hope – in 2010 Tower Hamlets was the seventh most deprived borough whereas today it is the 10th most deprived local authority in England, showing a distinct improvement in rankings in the past decade.
Take a look at the maps below to see where your street lies on the Victorian poverty maps.
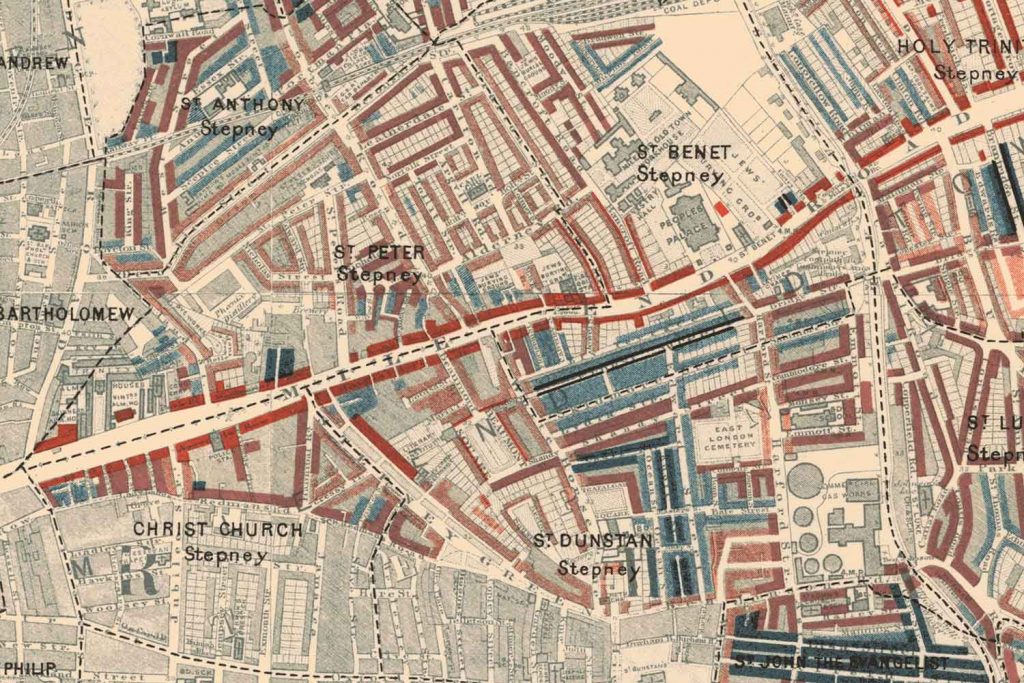
On the Stepney side, there are poorer streets mixed with these middle-class households, even some spots of black – areas where the poorest peoples live. Interestingly, Mile End today still has some of the most deprived areas in Tower Hamlets.
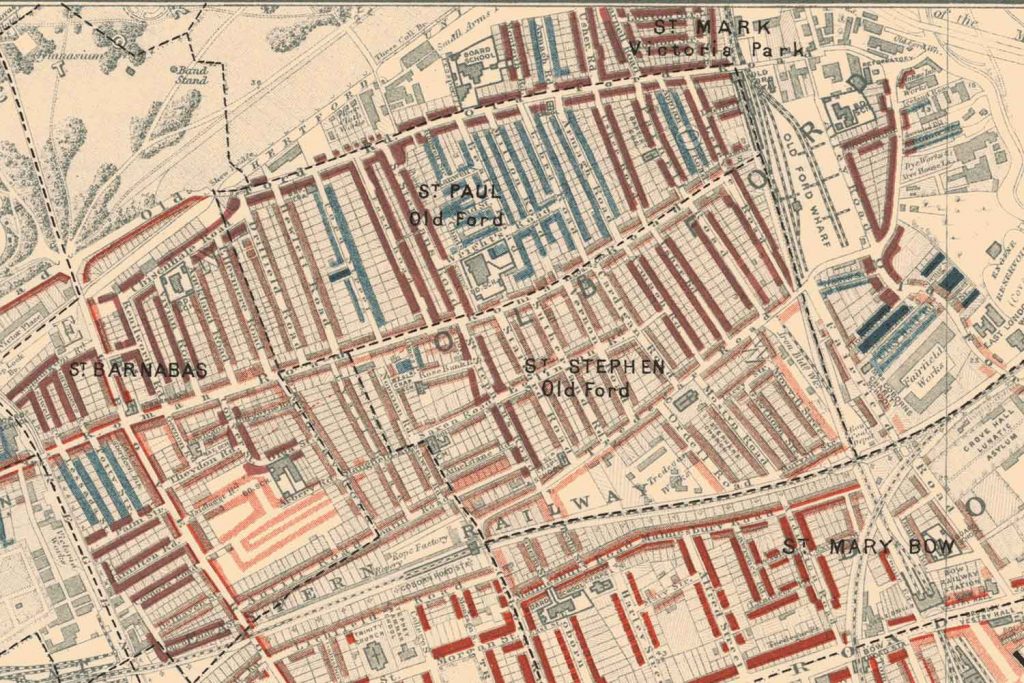
The Old Ford area north of Roman Road is a chunk of blue; a largely lower-income block. Meanwhile south of Roman Road is a more affluent area; St. Stephen’s Road is a deep red and the network of residential roads including Cardigan Road and Vernon Road are a mixture of poorer and more comfortable households.
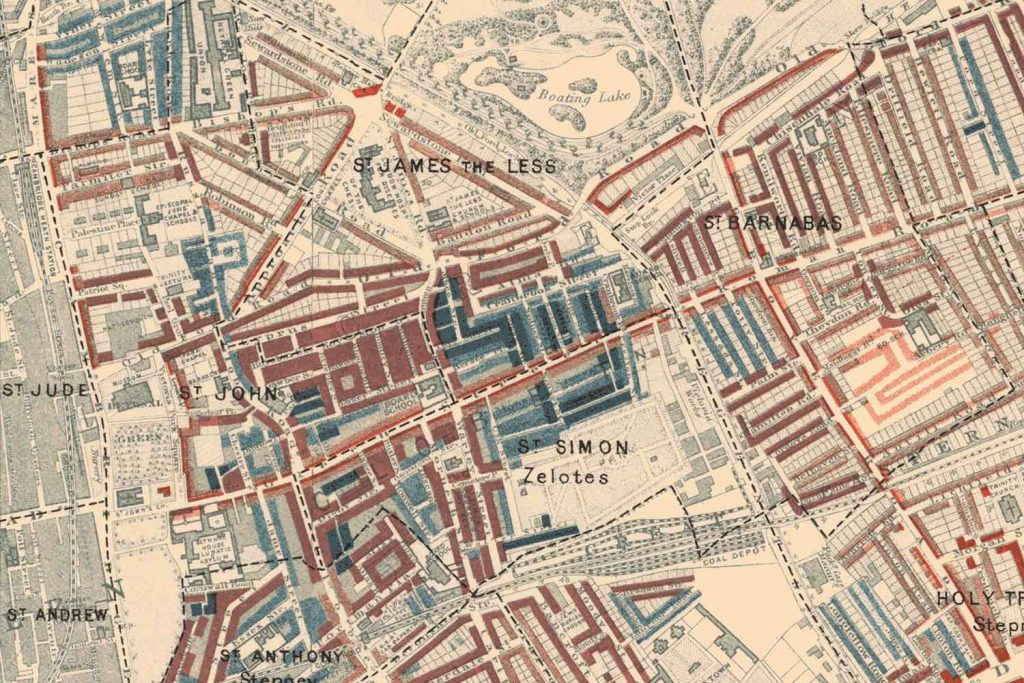
Globe Town was clearly a more working-class area, with clusters of blue just before the richer Bethnal Green on the left. You might still recognise some of these Globe Town names in blue, including Cranbrook Street.
Meanwhile, Bow is home to richer streets, Malmesbury road, Coburn Street and Morgan Street, as well as the main Bow Road, are all a solid chunk of red.
Click here to see the rest of Charles Booth’s poverty maps.
If you like this, you might also like to read about the oldest Jewish cemetery in the UK and the history of Wilton’s Hall.